Using the Gnu Debugger gdb
 The Free Software
Foundation ("Gnu") has also developed an advanced debugging
environment called "gdb" (for Gnu debugger). This debugger is useful
for tracing the progress of a program that has compiled "successfully"
(that is, it has no syntax errors), but is not running the way the coder expects
it to run. This page shows a couple of basic commands to help debug an input
file. Suppose we have a file hello-oops.c containing the following lines of code
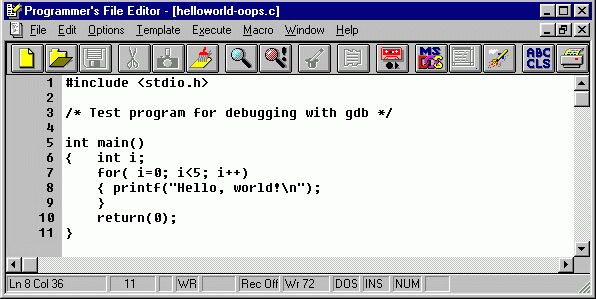
When we compile this input file using the Gnu C compiler gcc (see the C
Programming page), we see no error messages, so the syntax is apparently okay).
But suppose this is part of a larger, more complex piece of code, and we need to
understand exactly what is going on when these few lines are executed. It turns
out we can trace the progress of the execution using gdb by using the
"-g" option flag when compiling the code:
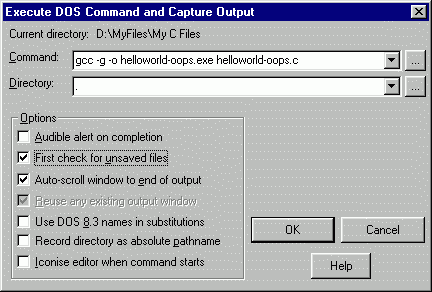
This inserts code in the executable file, helloworld-oops.exe, which enables
the tools in gdb to work. In the meantime, once the OK button is clicked, the
compilation process looks no different than it did without the "-g"
flag:

Now we go to work on the executable by invoking gdb as a DOS command:
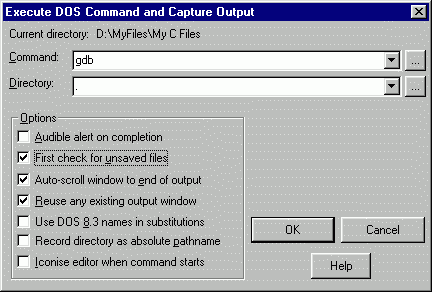
A DOS box appears in response:
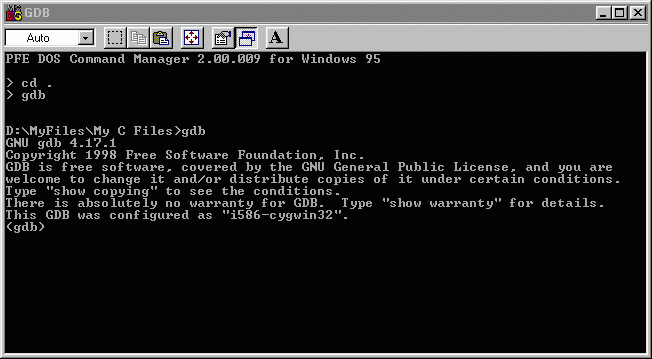
Designate the file to debug by indicating the executable file which we
compiled via the "-g" option by using the gdb "file"
command. The response looks like the following:

Keep the program listing open in the editor so that you are able to see line
numbers. Since we are just starting, set a "breakpoint" near the top
of the main() routine by placing it at line 7 using the gdb break command:

Now run the program, with the understanding that execution will stop at the
breakpoint, using the gdb run command:

Note that the program has stopped prior to executing line 7, the for() loop.
While line 6 has executed, declaring variable i to be an integer, no value has
been assigned to it because, again, line 7 has yet to be executed. But just for
grins, let's take a look at what value it contains anyway. We'll use the gdb
print command:

It shows a nonsensical value of 39320736, which is probably the number left
from whatever was going on in the particular address of memory now being
reserved for the integer i. The gdb print command can be used to show current
values of any declared variables at any time. It is one of the most important
tools to use when debugging larger programs.
Words of wisdom: Be sure to refer
often back to the open file in your editor so you can keep track of where
execution is, using the line numbers
For now, though, let's begin single stepping starting from the breakpoint
using the step or s command:

We have now moved past the initialization i=0 of the for() loop header, on to
line 8. Let's print the value of integer variable i now...
Note: gdb allows the abbreviation
"p" for the print command.

Now integer variable i contains the value 0. We can continue to step
through the program, one line at a time by continuing to invoke the gdb
"s" command several times...

Note what has happened: We single-stepped past the printf() command to the
next executable statement and the result Hello, world! appeared in the gdb
session, just as it would if the program were being run normally. Execution
stops at the top of the for() loop, since there are no more executable
statements in the remainder of the block over which execution is looping.
Single-step one more time to arrive at executable line 8 again. Now before going
on, let's show the current value of integer variable i using the print command:
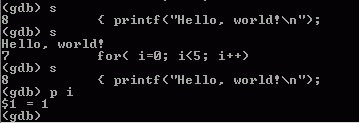
Note that the increment i++ portion of the for() loop has now been executed,
raising the value of integer variable i from 0 to 1.
Now the user can continue this process, using any of the many commands
available in gdb until a thorough understanding has been reached about just how
the program is executing. The coder can use this information to debug his or her
code.
For now, we'll stop by using the gdb continue command to reach the end of the
program:
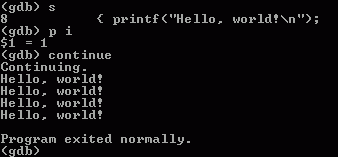
Typing "quit" at the (gdb) prompt exits the gdb session and the DOS
box closes.
![]()

